Reach & Discovery Analytics
Understand how YouTube is showing your content. Track impressions, click-through rates, and discover what makes viewers click.
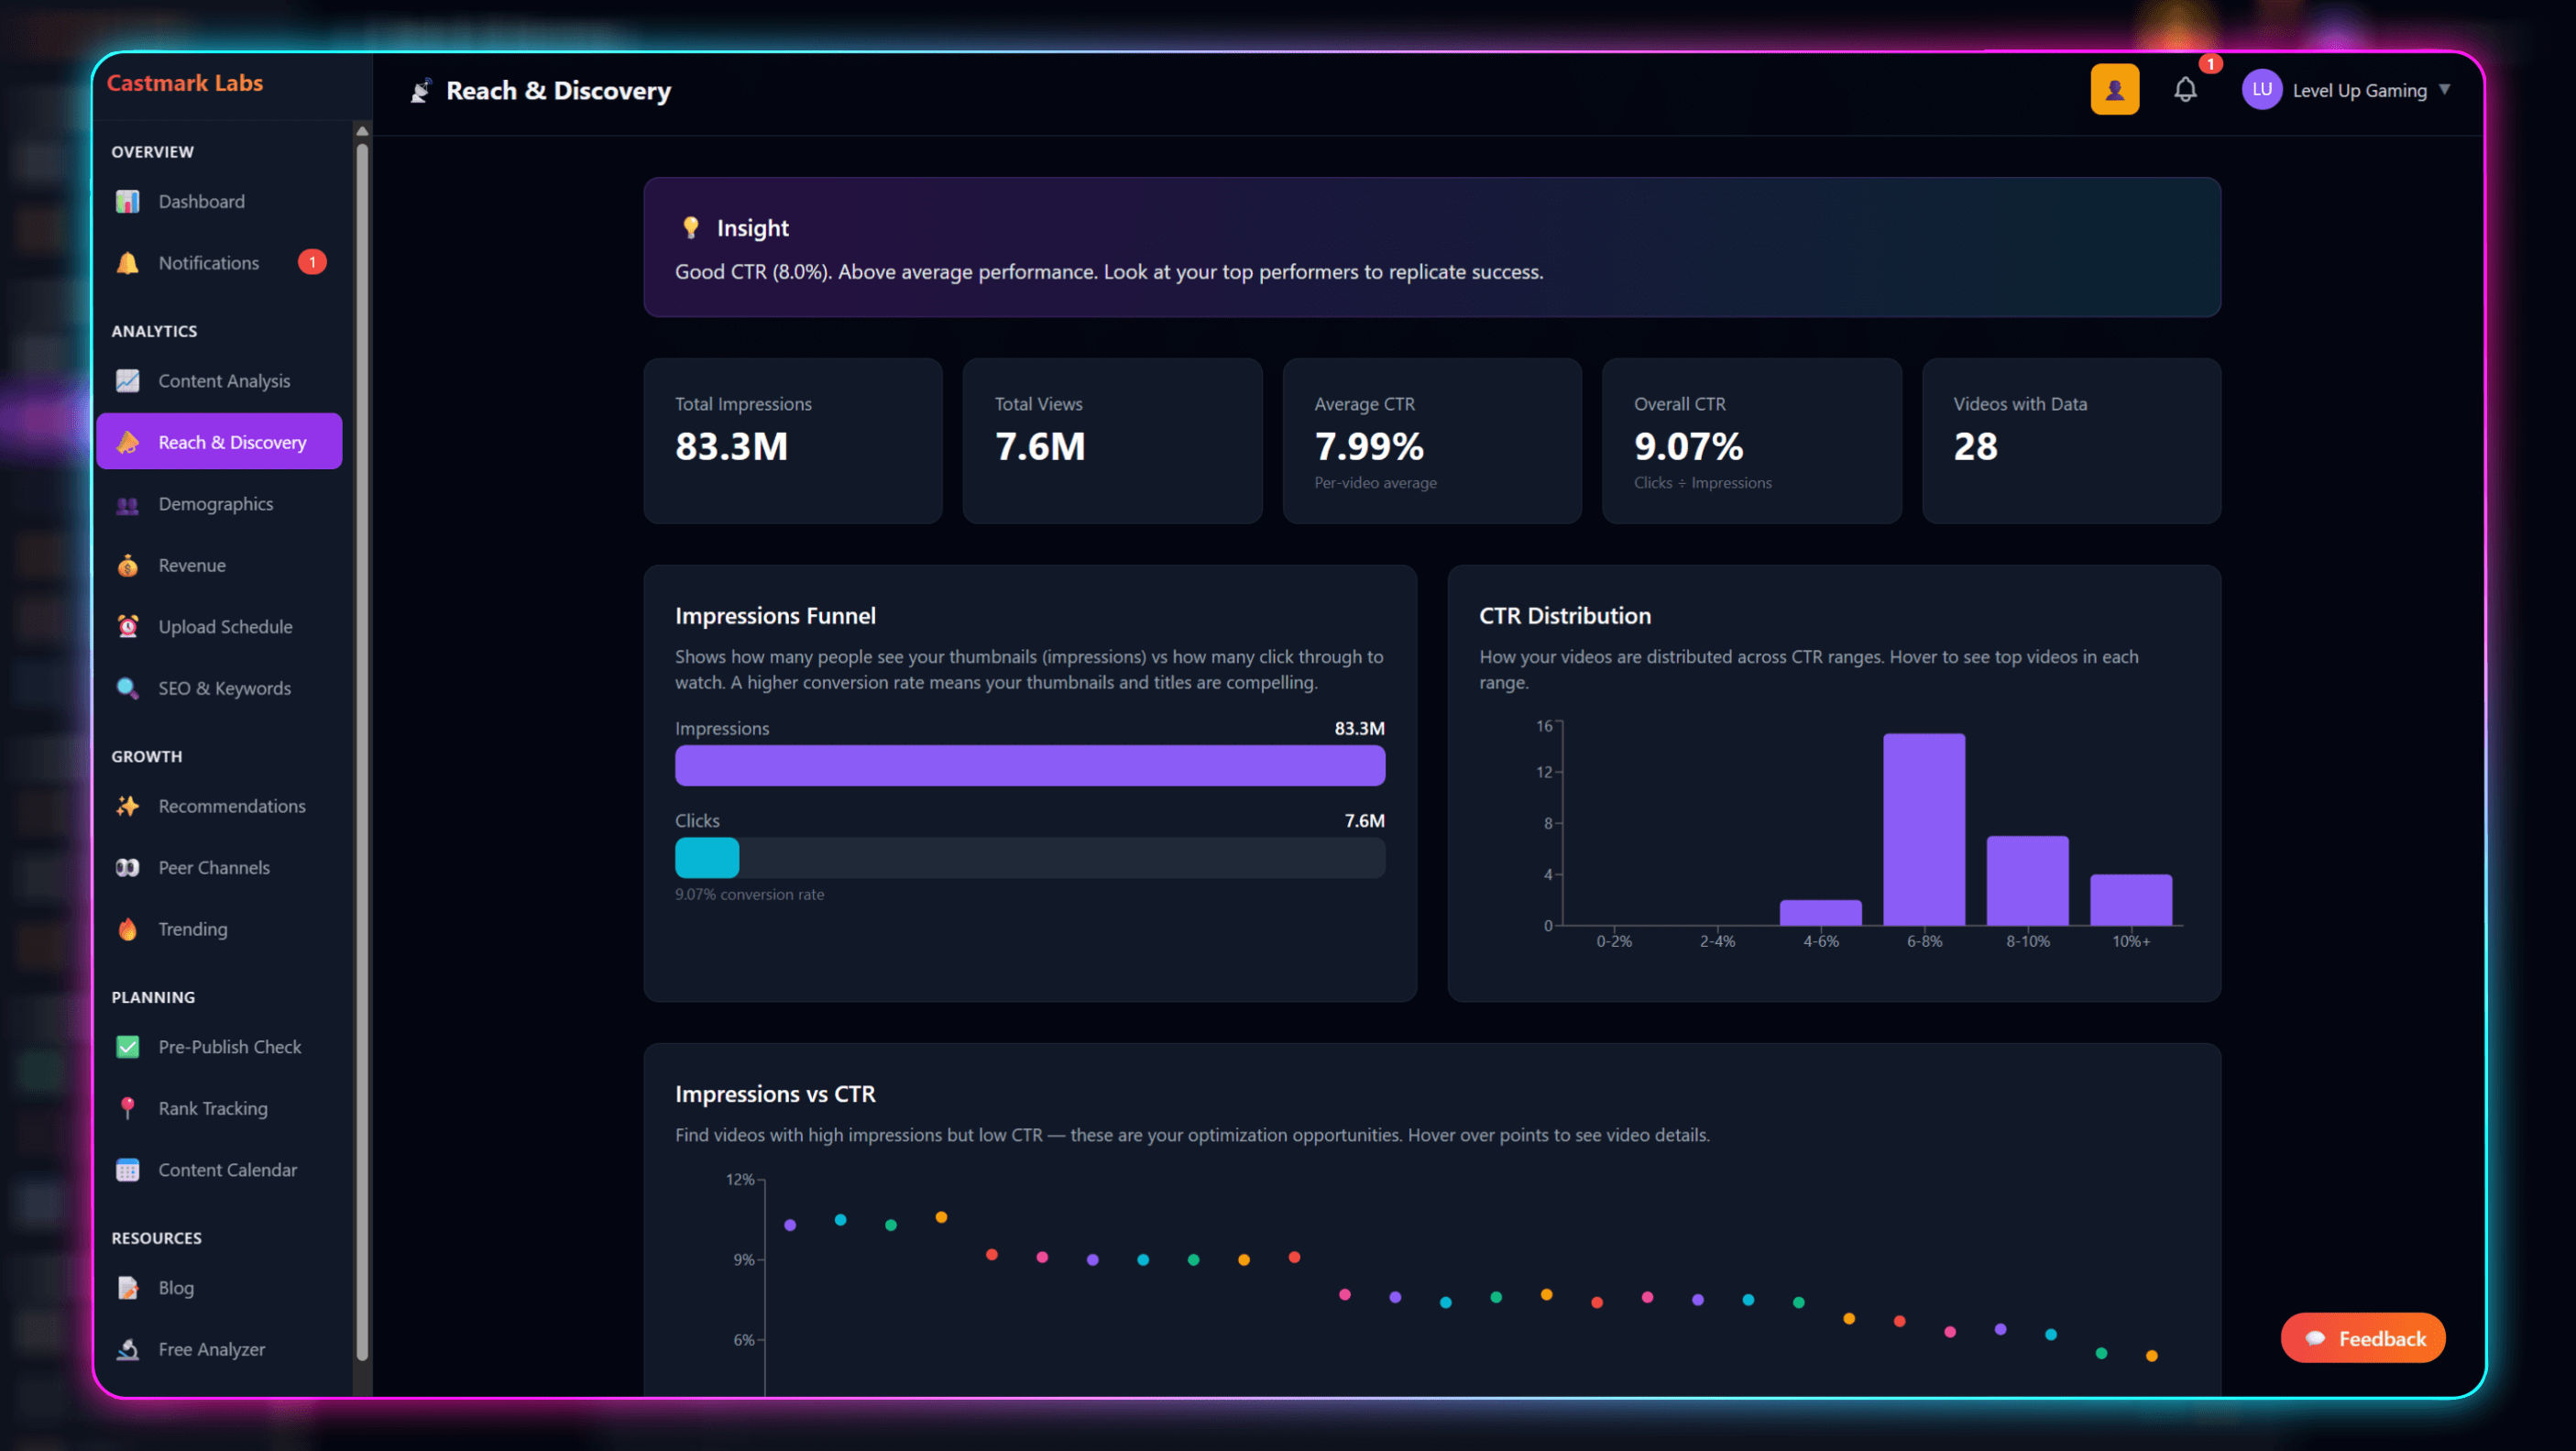
Metrics That Matter for Discovery
Impressions
How many times your thumbnails were shown to potential viewers. More impressions = more opportunities to get clicks.
Click-Through Rate
What percentage of people who saw your thumbnail actually clicked. Higher CTR = better titles and thumbnails.
Traffic Sources
Where your views come from — Search, Suggested, Browse, External. Know which discovery paths work best.
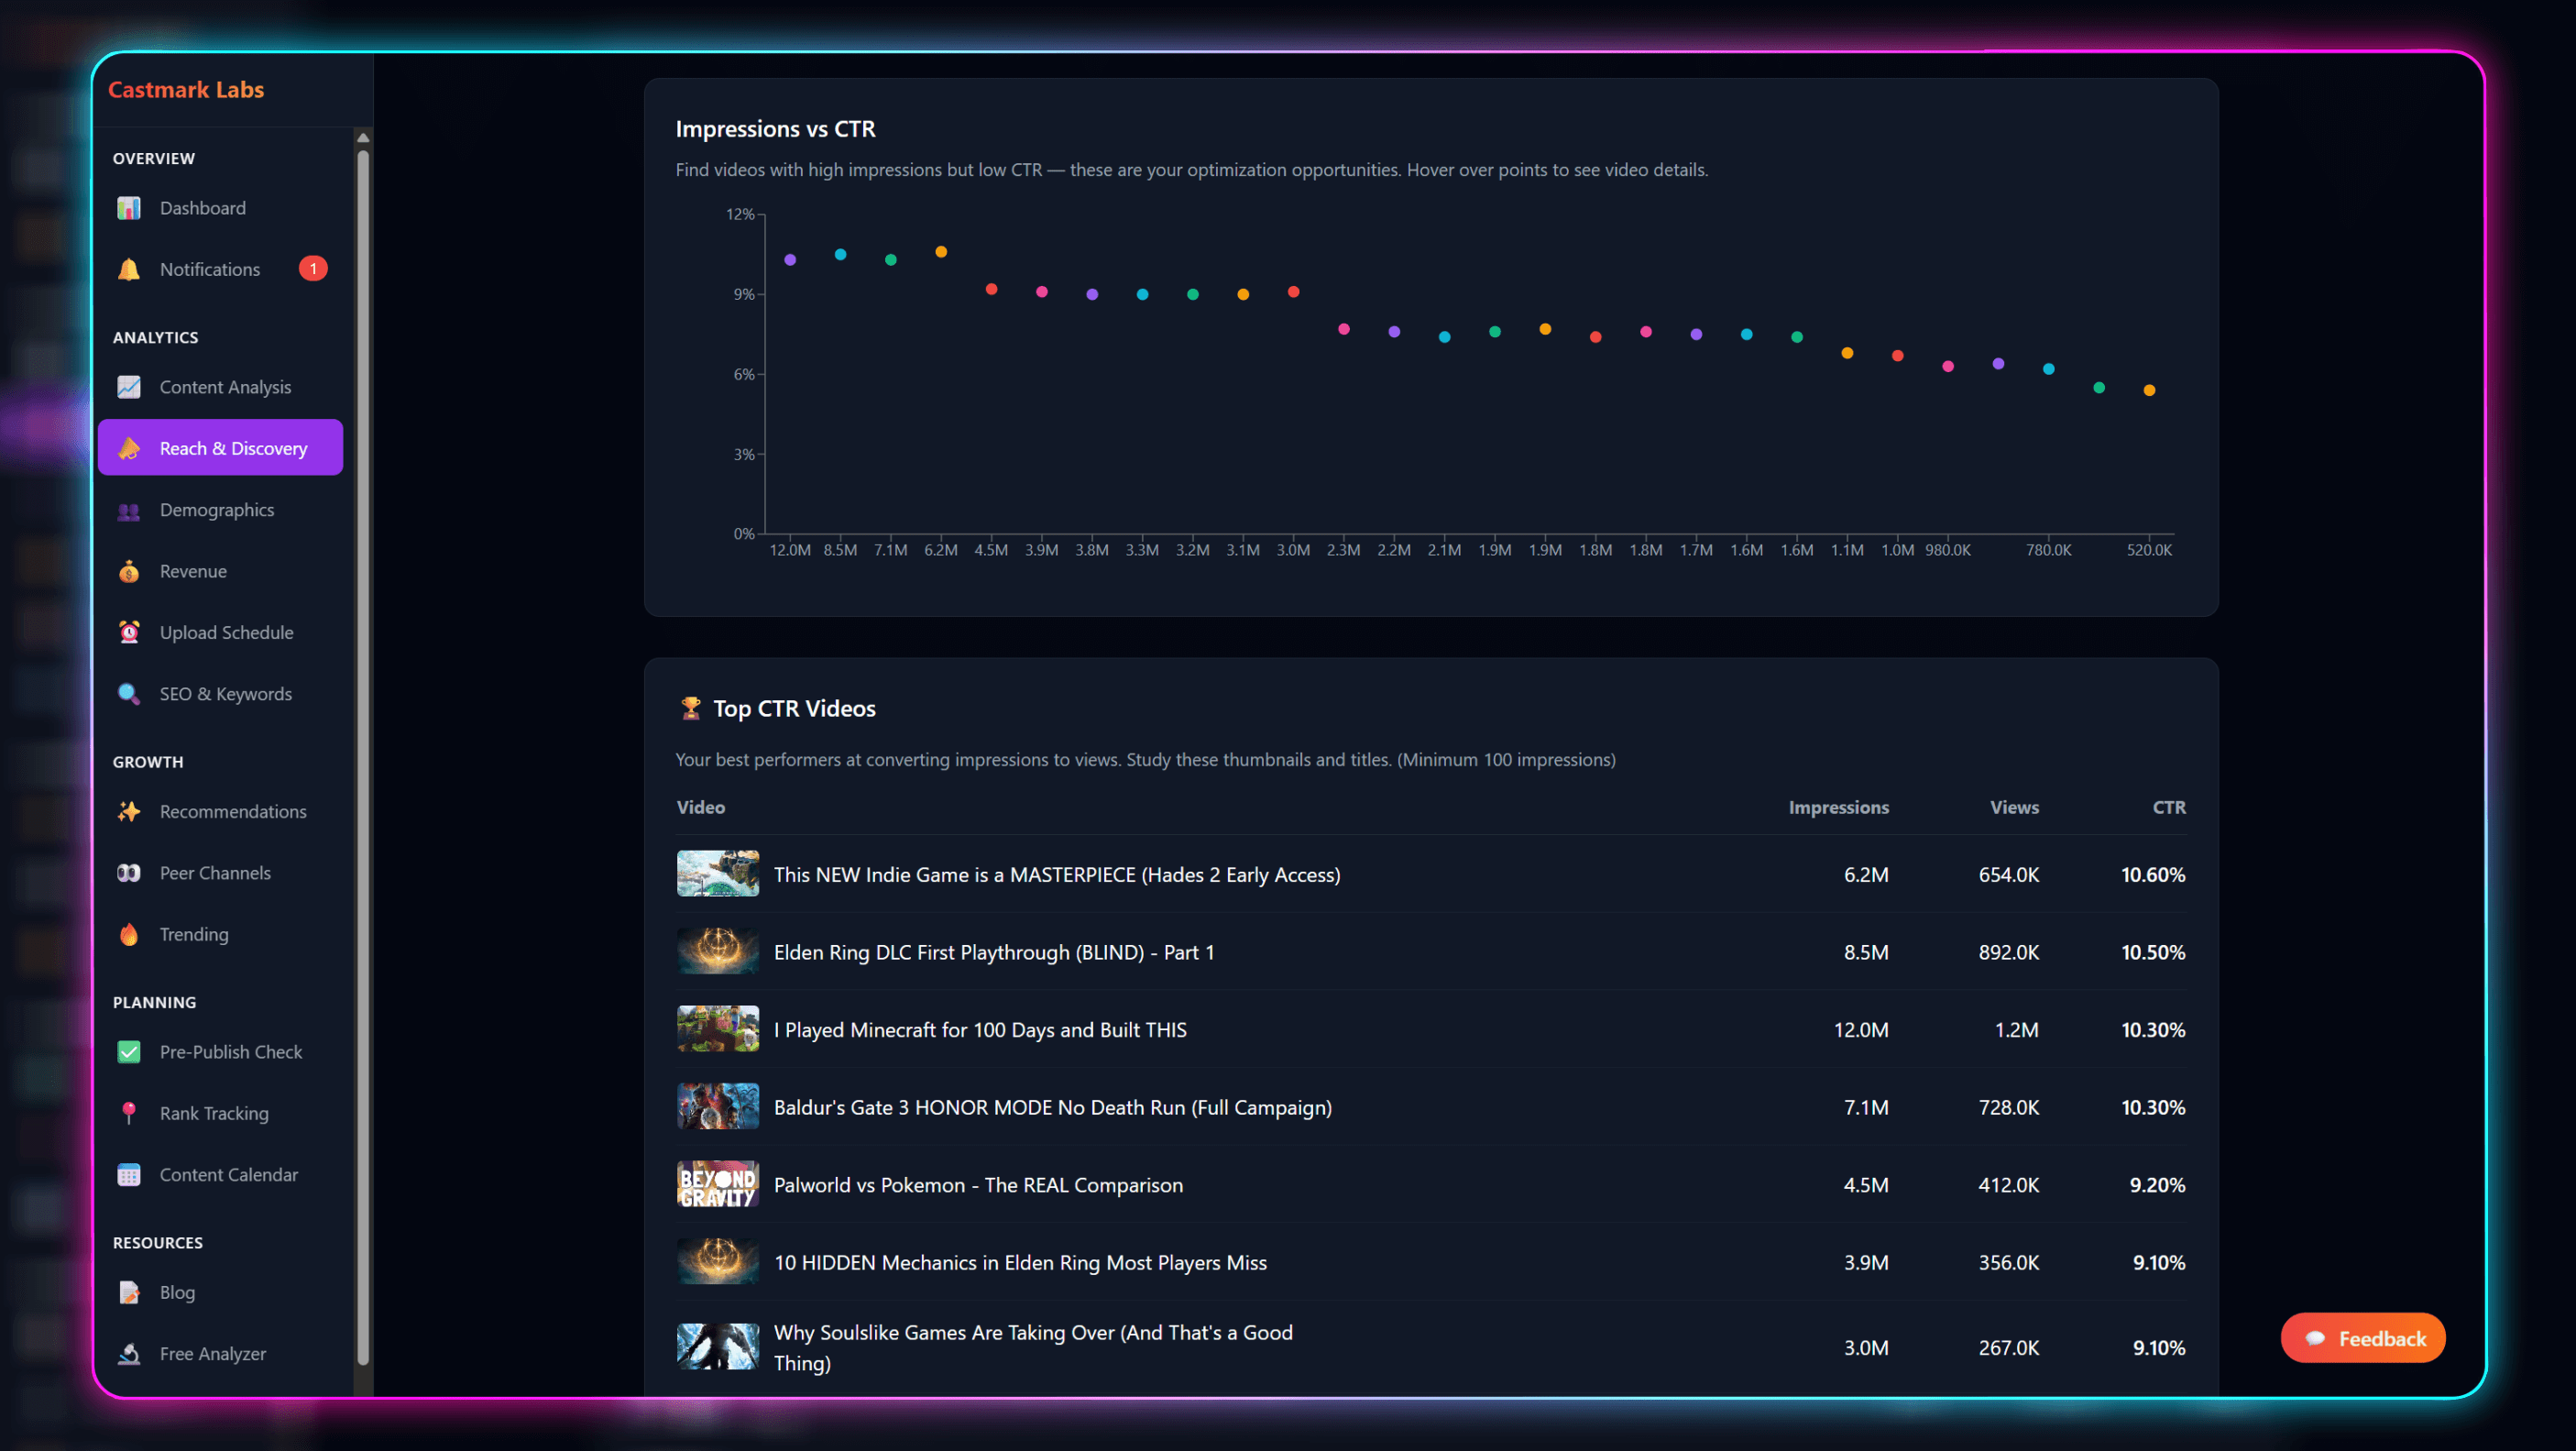
Optimize Your Click-Through Rate
CTR is one of the most important metrics for YouTube growth. A higher CTR means YouTube will show your videos to more people.
What's a good CTR?
- Below 2% — Needs improvement
- 2-5% — Average
- 5-10% — Good
- Above 10% — Excellent
We track your CTR over time so you can see how changes to your thumbnails and titles affect performance.
Track Impressions Over Time
See how YouTube's algorithm is treating your channel. Rising impressions mean YouTube is showing you to more people.
- ✓Daily and weekly impression trends
- ✓Per-video impression breakdown
- ✓Impressions vs views correlation
- ✓Historical data comparison
Unlock Your Channel's Discovery Potential
Start your 14-day free trial and see your reach analytics today.
Start Free Trial →